Project Information
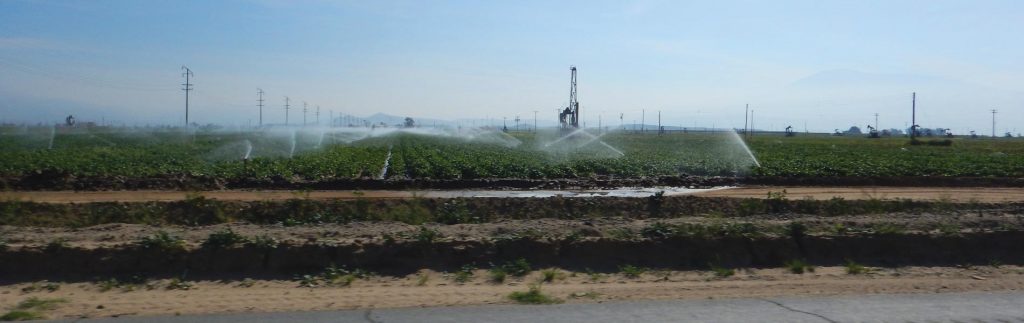
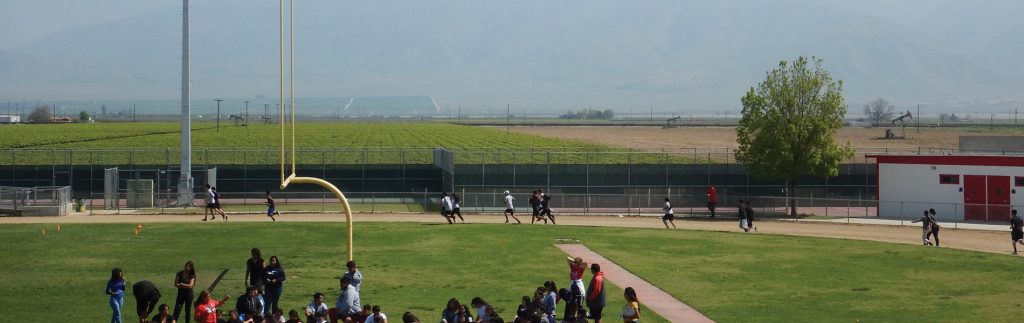
Located in the southern San Joaquin Valley airshed, the town of Lost Hills is often exposed to poor air quality from pollutants that are emitted from vehicles and various industrial activities. According to CalEnviroscreen, Lost Hills is in the 95th percentile for total pollution burden, including the 82nd percentile for Ozone Pollution and 84th percentile of PM 2.5 pollution in the state.
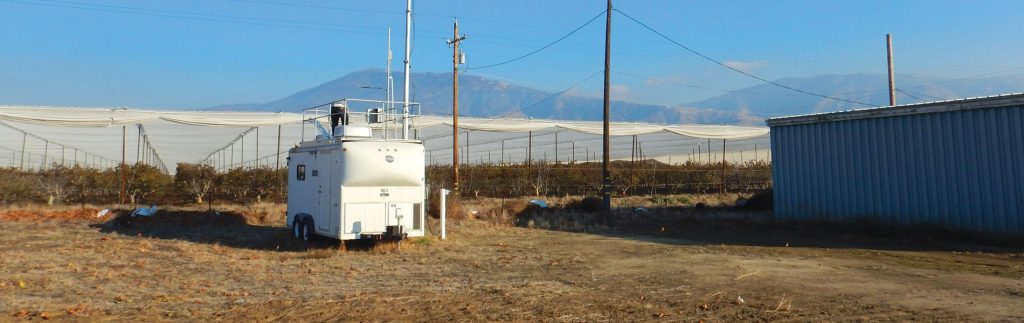
For this project, seven locations are being continuously monitored for particulate matter (PM2.5 & PM10), nitrogen dioxide (NO2), ozone (O3), methane (CH4), and Volatile Organic Compounds (VOCs). Real-time results from air monitoring sensors are presented on this website to inform Lost Hills residents of the air quality in their community. This information can be used to:
- Help determine major pollutant sources by analyzing fluctuations of contaminants in different parts of the community
- Educate and empower the local community so they can limit their exposure to harmful air pollutants and protect sensitive populations (children, elderly, and indigent)
- Bring greater awareness to the air quality issues in and around the Lost Hills area.
How to use this website
Click here to review Website Guide in English
Haga clic aquí para La Guía del Usuario en Español

Sensor Calibrations and Pollutants Being Monitored
The data presented on this website includes ambient outdoor levels of ozone (O3), nitrogen dioxide (NO2), Volatile Organic Compounds (VOCs), and two sizes of fine particulate matter (PM2.5 and PM10). Pollutants are continuously monitored and results are updated every 60 seconds — refresh your browser to get the latest results.
Gases are measured using passive chemical electrode sensors that output voltages in response to changing levels of pollutants in the air. Algorithms are used to convert these voltages into concentrations of O3 and NO2.
Due to the sensitivity of sensors utilized in the air quality monitoring units, changes in temperature and humidity can impact pollutant concentration levels. Data reported during storm events may not be as reliable as during mild weather conditions. When sensors report unrealistically high values due to weather or malfunctioning hardware the concentration reported on the website will be zero.
Sensor Calibration
Efforts to calibrate the O3, NO2, PM2.5, and PM10 sensors are undertaken weekly. State and Regional operated sensors in southern California are used to calibrate these sensors through collocation, where the air quality monitoring units are placed next to State and Regional operated monitoring stations for a minimum of two weeks. After collocating, sensor data is compared, and calibration coefficients are applied if necessary to bring the Lost Hills air quality monitoring unit results into better agreement with State and Regional results.
The Data
Particulate Matter (PM2.5 & PM10)
Particulate matter concentrations are measured as PM2.5 and PM10. PM2.5 are airborne particles with diameters of 2.5 micrometers or smaller and PM10 are particles equal to or smaller than 10 micrometers in diameter. Concentrations are measured in micrograms per cubic meter (µg/m3) using an Alphasense OPC-N3 particulate counter. In a field evaluation performed by South Coast Air Quality Management District (SCAQMD), the Alphasense OPC-N2 showed “overall good correlation with substantially more expensive instruments (GRIMM and BAM; EPA-approved FEM methods)”. A summary of the SCAQMD report can be found here, and the full SCAQMD field evaluation can be found here.
Particulate matter is generated by fossil fuel combustion in motor vehicles, agricultural burning, construction, and oilfield operations. Exposure to these particulates at elevated levels can result in increased risk of cardiovascular and respiratory illnesses, including cardiopulmonary and lung cancer. Certain populations, including children, pregnant women, the elderly, and those suffering from asthma or bronchitis are especially vulnerable to health conditions resulting from inhaling these fine particulates.
Ozone (O3)
Ozone (O3) is a highly reactive gas and concentrations are measured in parts per billion (ppb). Ground level ozone is created by chemical reactions between oxides of nitrogen (NOx) and volatile organic compounds (VOCs) in the presence of sunlight. For this reason, ozone concentrations are typically highest in the afternoon during summer days with longer more intense daylight hours. Emissions from oil refineries, motor vehicles exhaust, gasoline vapors, and chemical solvents are some of the major sources of NOx and VOC (USEPA). According to the US EPA, exposure to unhealthy ozone levels can result in difficulty breathing, increased asthma attacks, higher susceptibility to lung infection, and respiratory illnesses, including chronic obstructive pulmonary disease (COPD).
Nitrogen Dioxide (NO2)
Nitrogen Dioxide (NO2) concentrations are measured in parts per billion (ppb). NO2 levels are often highest during the nighttime because during the day NO2 reacts with sunlight in a chemical process that forms ozone (O3). Emissions from vehicles, construction, agricultural, and industrial operations are major sources of NO2. Harmful health effects from exposure to high levels of NO2 include respiratory illnesses and infections, most notably in sensitive populations including children and the elderly.
Methane (CH4)
Methane (CH4) concentrations are measured in parts per million (ppm). Methane is a colorless, odorless gas that, while not inherently toxic to humans, is a very potent greenhouse gas that can impact global climate change. Agriculture and oil and gas production are the main sources of methane emissions in California.
Volatile Organic Compounds (VOCs)
Volatile Organic Compounds (VOCs) are a class of gases that contain hundreds of compounds. These compounds react with nitrogen oxides in the atmosphere to form ozone. Measurements provided by the VOC sensors are given in millivolts (mV) and indicate the presence of a portion of the group of compounds that are considered VOC’s. Due to the capacity of the VOC sensor, these measurements provide only a general representation of the presence of VOC’s. A concentration can be determined if a specific VOC being measured is known. Sources of VOCs include emissions from motor vehicles, refineries, and other industrial operations. Some VOCs may cause short- and long-term adverse health effects, such as cancer and damage to the liver, kidney, and the central nervous system.
The data presented here includes concentrations of ozone (O3), nitrogen dioxide NO2), Volatile Organic Compounds (VOCs), and two sizes of fine particulate matter (PM2.5 and PM10). Results are updated every 60 seconds — refresh your browser to get the latest results.
PM10
PM10 are airborne particles that range from 2.5 to 10 micrometers in diameter. Concentrations are measured in micrograms per cubic meter (µg/m3).
Sources of PM10 include vehicles, agriculture, construction, and industrial activities. Exposure to these particulates at elevated levels can result in increased risk of cardiovascular and respiratory illnesses, including cardiopulmonary and lung cancer. Certain populations, including children, pregnant women, the elderly, and those suffering from asthma or bronchitis are especially vulnerable to health conditions resulting from inhaling these course particulates.
PM2.5
PM2.5 are airborne particles with diameters of 2.5 micrometers or smaller. Concentrations are measured in micrograms per cubic meter (µg/m3).
PM2.5 particles result from combustion in motor vehicles, agricultural burning, and oilfield operations. Exposure to these particulates at elevated levels can result in increased risk of cardiovascular and respiratory illnesses, including cardiopulmonary and lung cancer. Certain populations, including children, pregnant women, the elderly, and those suffering from asthma or bronchitis are especially vulnerable to health conditions resulting from inhaling these fine particulates.